CompletedData engineering · Analytics
Dividend recovery analytics
A data platform and app I co-built to study how often share prices recovered after ex-dividend dates, and how long recovery took.
4 min read
The source is private, but I'm happy to talk through how it works and show a demo.
- dividend-paying stocks in the filtered dataset we analysed (December 2024 export)
- 13,967
- historical ex-dividend events analysed, across 52 exchange codes
- 440,953
- of events in the filtered set recovered the pre-ex-dividend close within 15 trading days, in data to December 2024
- 63%
- trading days: the typical stock's median recovery time in the filtered set, for events that recovered
- 4
Technology
- Python
- pandas
- PostgreSQL
- AWS RDS
- AWS EC2
- AWS Secrets Manager
- Streamlit
- Altair
- Docker
- pgvector
- Voyage AI
- Llama 3.1 70B
The question
On the ex-dividend date, buyers of the stock no longer receive the upcoming dividend, so the price usually drops by about that amount. Some stocks climb back within days. Others take months, or never get back to where they were. For anyone considering dividend capture (buying before the ex-dividend date to collect the dividend, then selling once the price has recovered), two questions matter: how reliably a given stock recovers, and how quickly.
A co-founder and I, who had started a small financial-analytics venture, built an app to answer these questions across thousands of stocks. It let users screen stocks and look at each company’s recovery history, and it ran on a data platform that measured recovery after each ex-dividend event.
Data
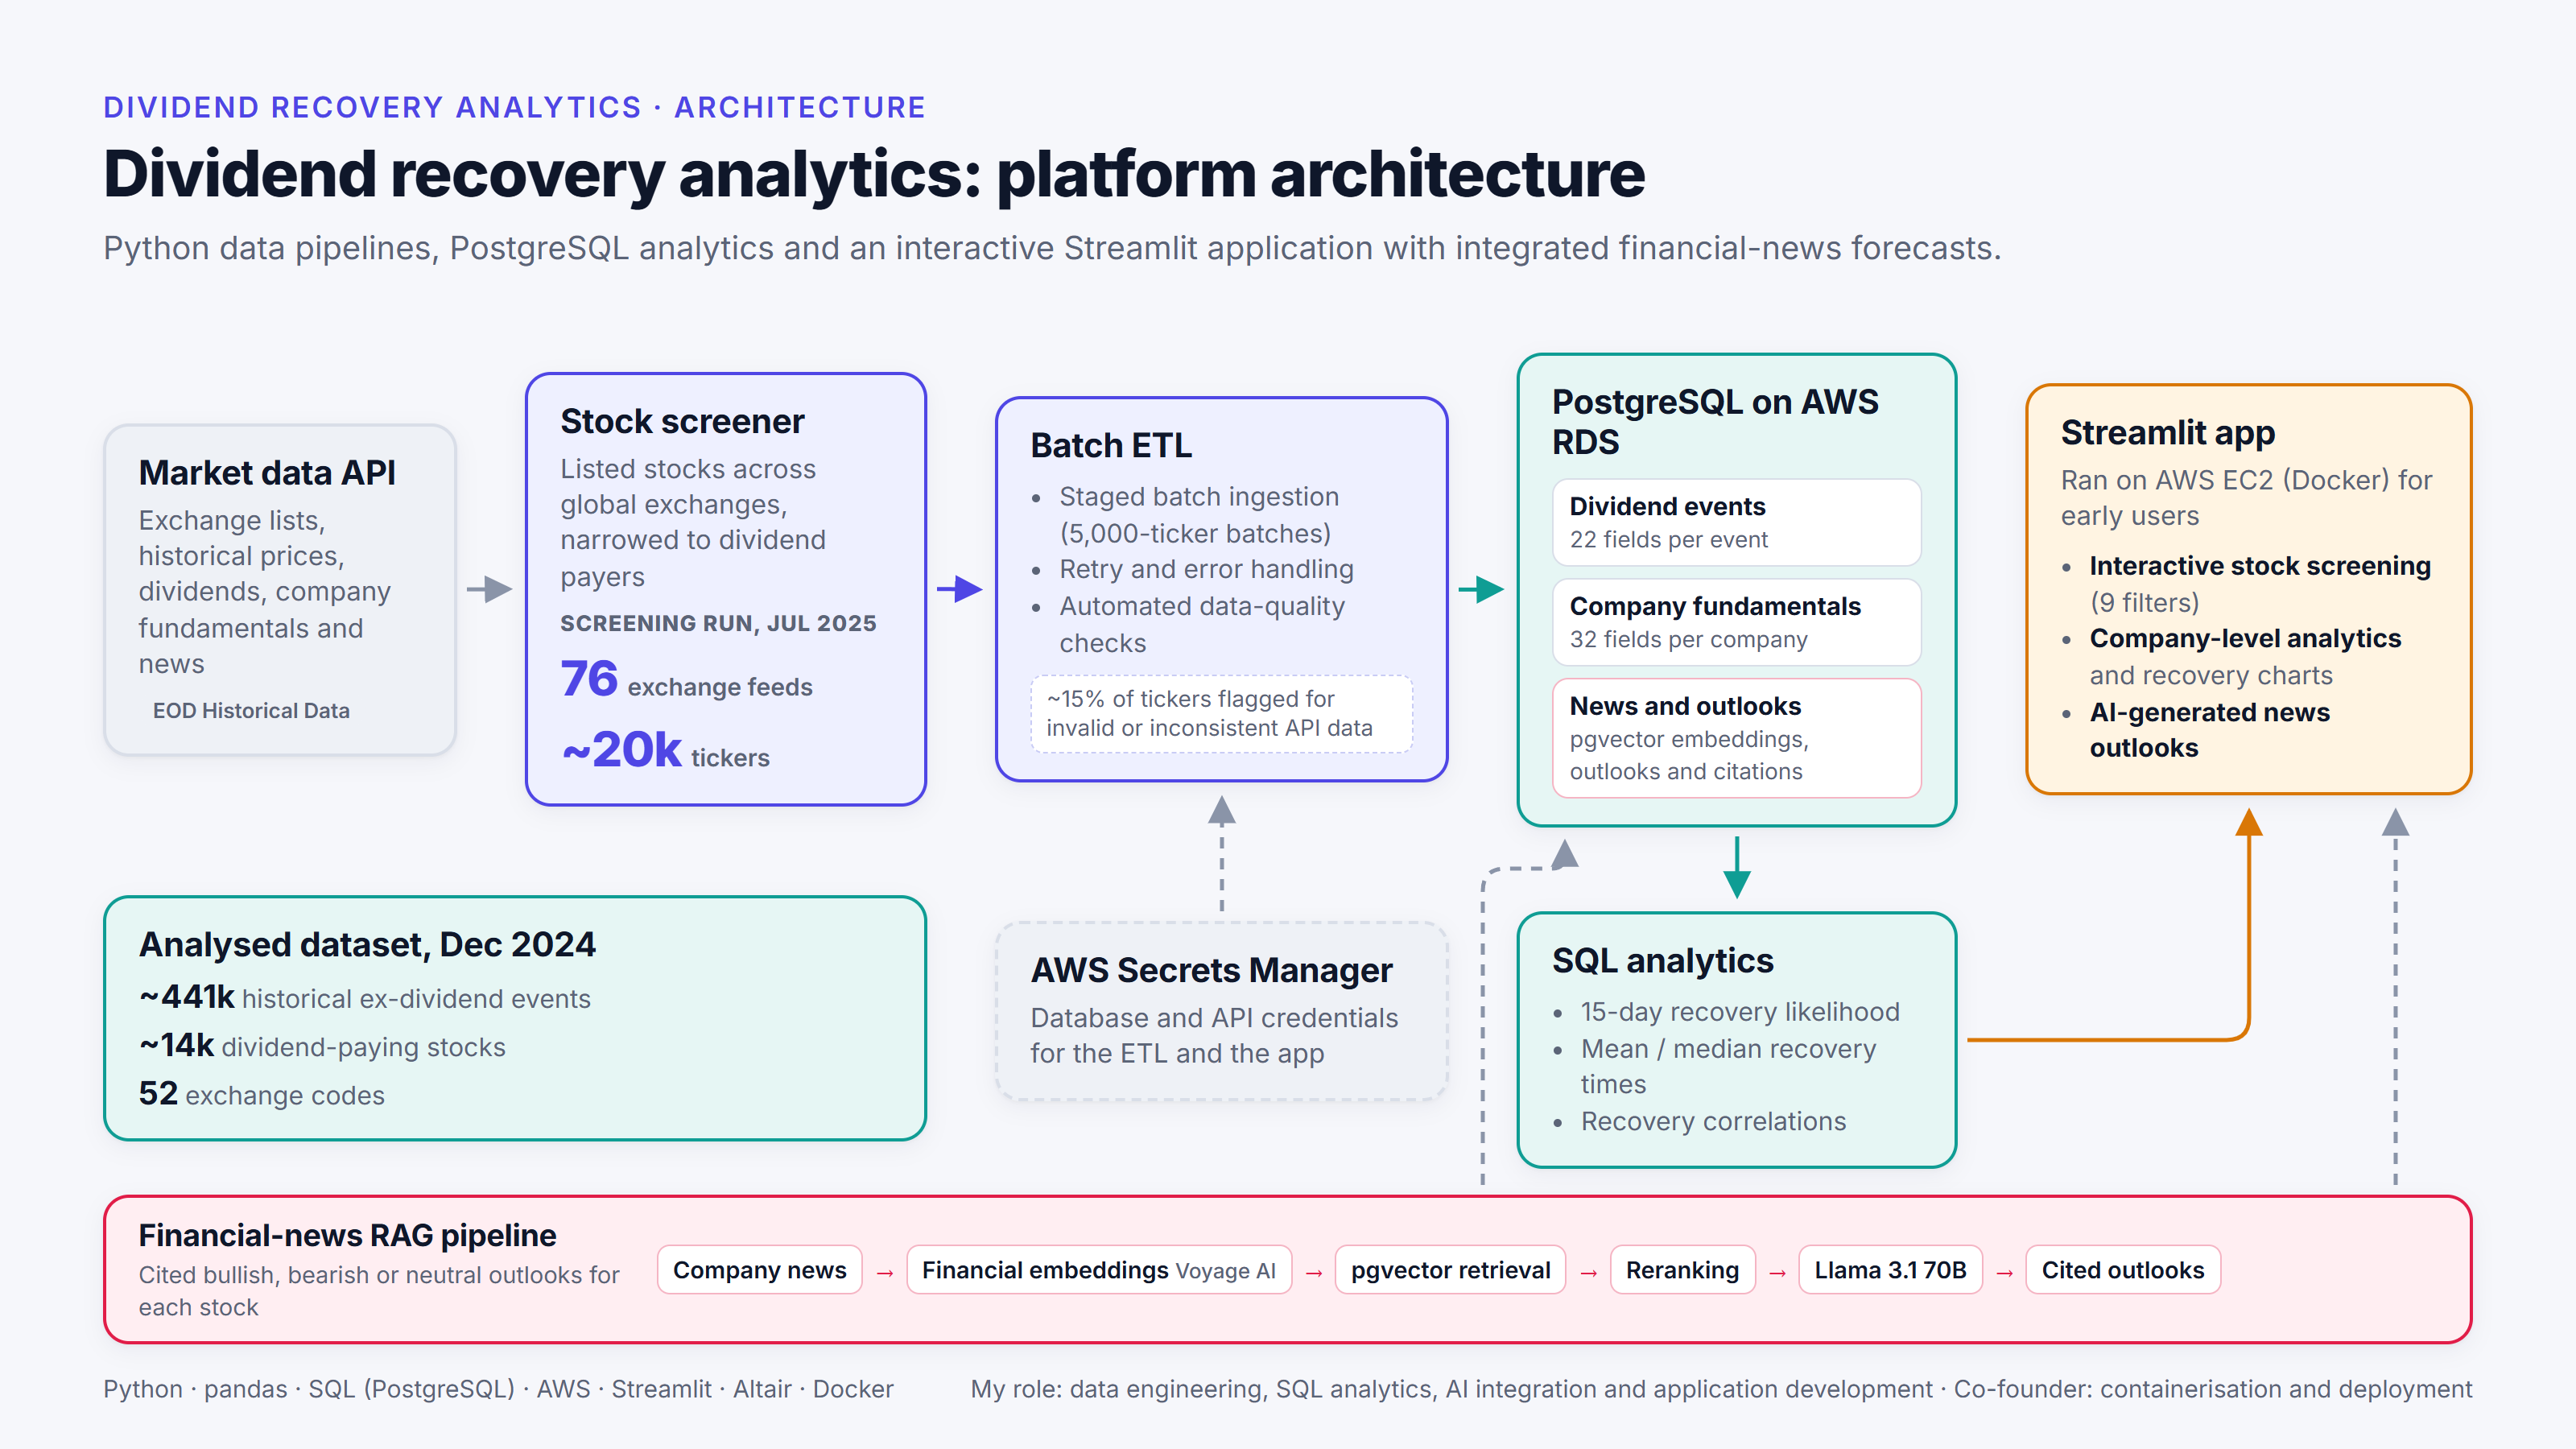
Python pipelines pulled price, dividend, fundamentals and company-news data from the EOD Historical Data API.
The analysed dataset is an export from December 2024. It covers 13,967 dividend-paying stocks and 440,953 ex-dividend events across 52 exchange codes, with each stock’s full available price history up to the export. How far back that history goes varies from stock to stock. The stocks are a filtered subset that we chose to analyse, so the findings below apply to that subset only.
The screening figures come from a separate, later stage. In July 2025, the daily screener for the production app ran across 76 exchange feeds and, once a minimum-yield filter was removed, listed 19,885 tickers.
Method and findings
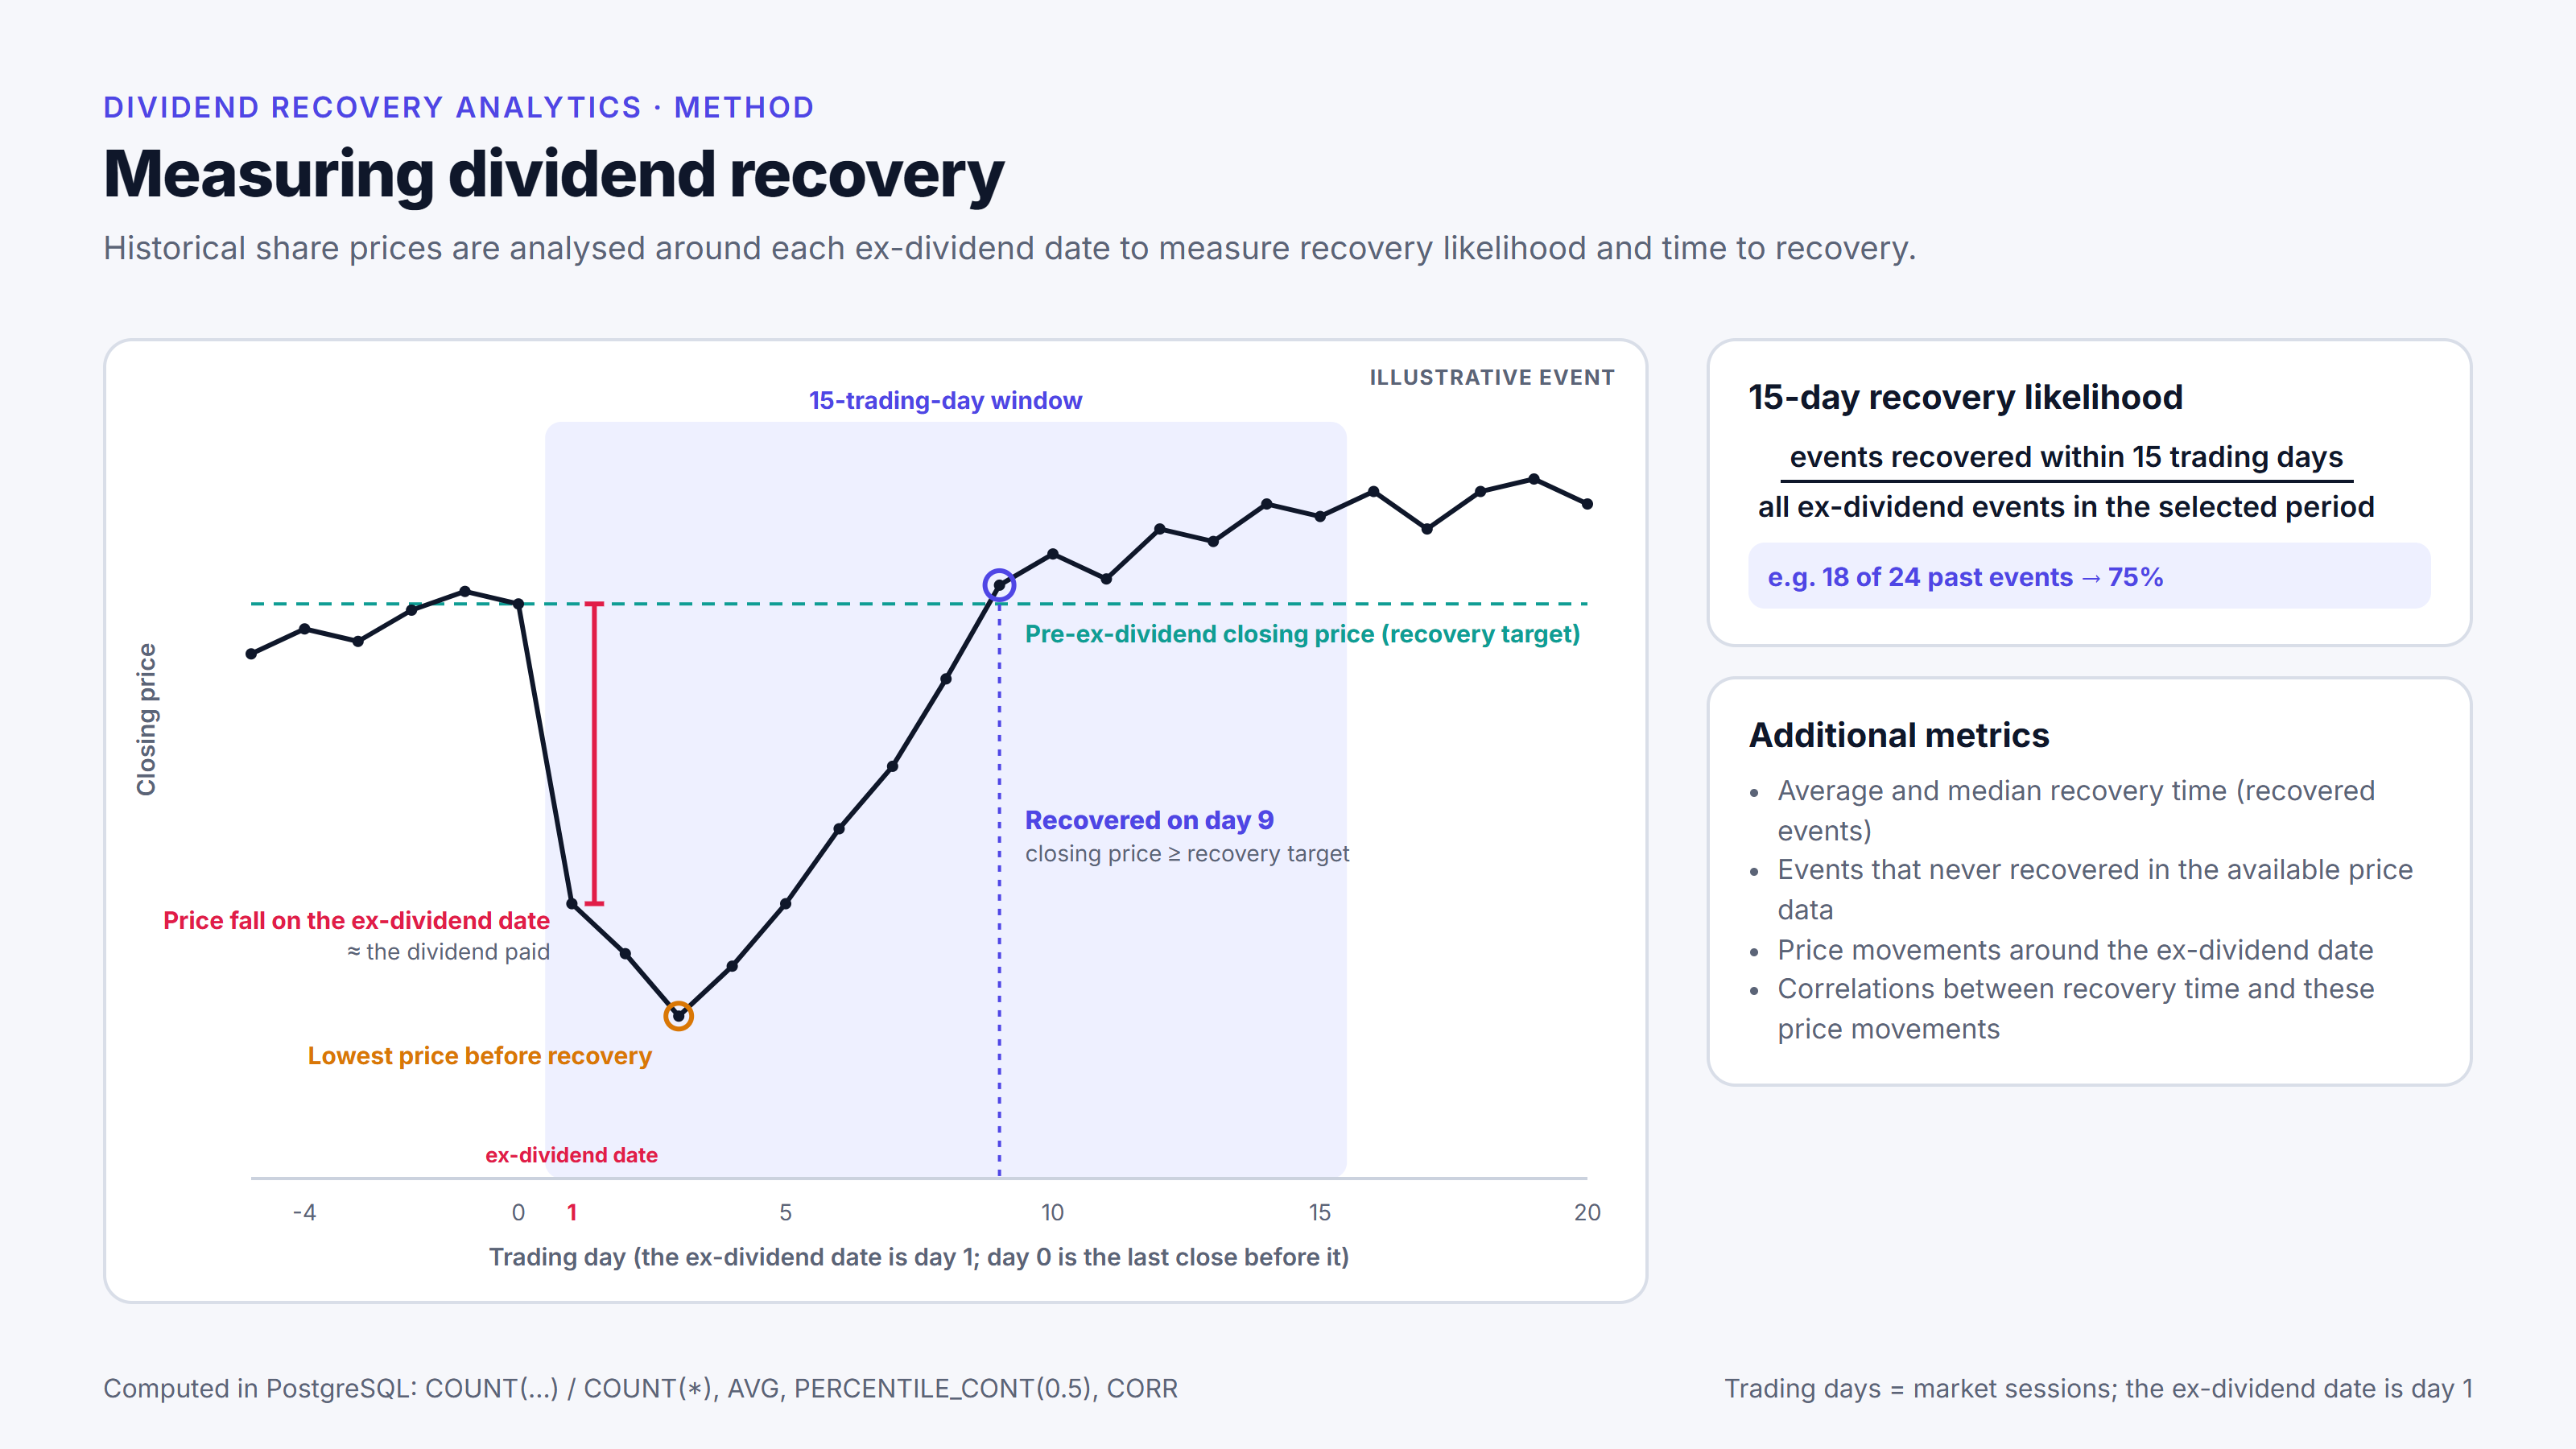
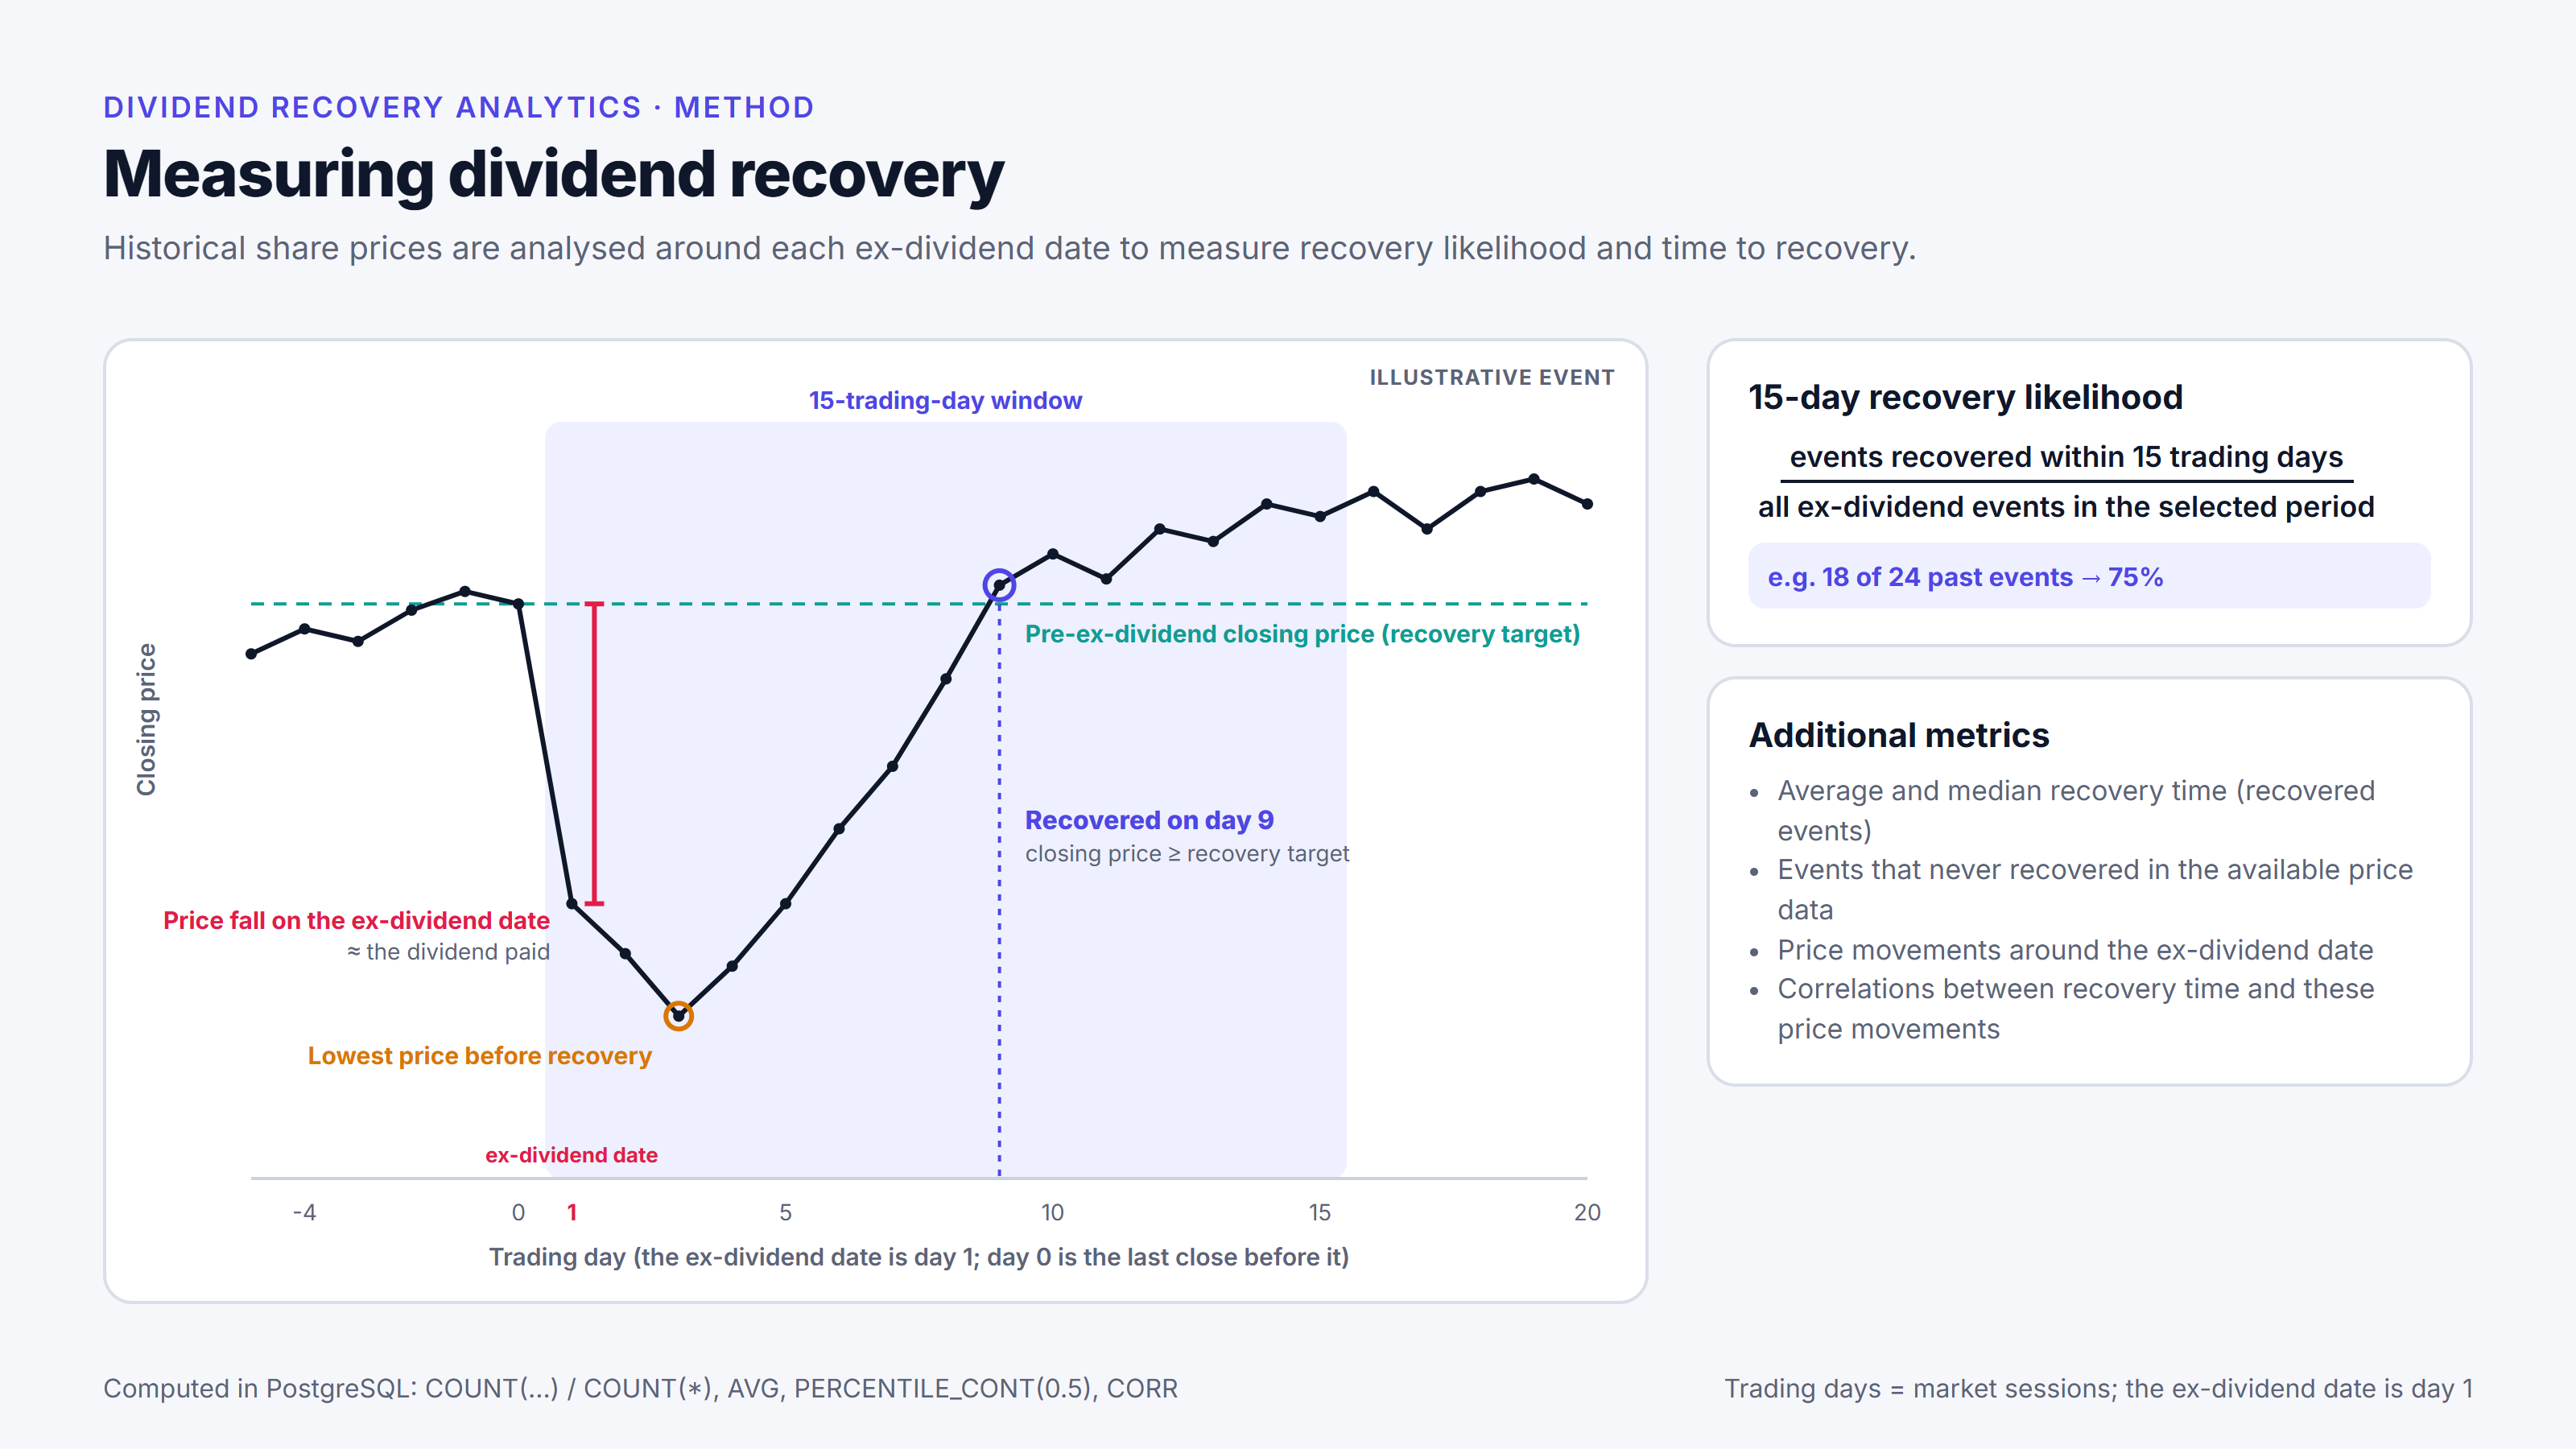
An event counts as recovered when the stock’s closing price gets back to at least its closing price on the day before the ex-dividend date. Recovery time is counted in trading days, with the ex-dividend date as day 1.
For each stock, SQL queries calculated:
- a 15-day recovery likelihood: the events that recovered within 15 trading days, divided by all ex-dividend events in the selected period, so events that never recovered stay in the denominator;
- mean and median recovery times, over the events that recovered;
- correlations between recovery time and price movements around the ex-dividend date.
As a check on the app’s numbers, the headline figures were later recalculated from the December 2024 export, and the recalculation agreed with the app. About 63% of ex-dividend events (63.04%) recovered their pre-ex-dividend closing price within 15 trading days, and 13.8% never recovered within the available price history. For the typical stock, the median recovery time was 4 trading days. To get that figure, each stock’s own median recovery time was worked out first, counting only the events that recovered, and the 4 days is the middle value of those per-stock medians. If all recovered events are pooled instead, whichever stock they belong to, the median is 3 trading days.
The distribution has a long tail, so the averages sit well above the medians. Non-recoveries were tracked separately rather than dropped. These figures describe what happened in historical data up to December 2024. They aren’t a prediction or an expected return.
Users explored the results in a multipage Streamlit app, with nine interactive filters and a company view with recovery charts. It ran on AWS EC2 in Docker for a group of early users.
Pipeline and data quality
I designed and built the data pipelines and the SQL analytics. The ETL (extract, transform, load) pipeline took data from the API, transformed it in Python and loaded it into PostgreSQL on AWS RDS in staged batches, with credentials held in AWS Secrets Manager. Error handling was built in: failed operations were retried with backoff (a longer wait before each new attempt), and each run logged its progress and any errors.
The data was validated at two levels: automated checks ran on each batch, and database-level checks looked for missing values (nulls) and mismatches. About 15% of tickers were flagged for invalid or inconsistent API data; they were logged and skipped in later runs.
The database held a 22-field record for each ex-dividend event and a 32-field fundamentals record for each company. The event record included the price fall on the ex-dividend date, the trading days taken to recover, the lowest price before recovery, the move before the ex-dividend date and the 52-week range. Refreshes were incremental, loading only events newer than the latest stored date. Later runs also re-checked earlier events that hadn’t recovered yet, and updated their records once they had. Without that step, an event that hadn’t recovered when it was first loaded would have stayed recorded as unrecovered.
After the error handling and checks had been strengthened, the production ETL pipeline ran 13 consecutive times with no unhandled errors.
Financial-news outlooks (RAG)
From 2024, I also built a retrieval-augmented generation (RAG) pipeline into the platform. In this context, RAG meant retrieving relevant news articles and giving them to a language model along with the question, so that its answer was based on those articles. The aim was a short, news-based outlook for each stock:
- company news came from the same market-data API and was added incrementally, so the collection grew over time;
- the articles were split into chunks, embedded with Voyage AI’s finance model and stored with pgvector in the same PostgreSQL database;
- for each stock, the most relevant chunks were retrieved and then reranked;
- Llama 3.1 70B was prompted for a bullish, bearish or neutral outlook, and the articles it drew on were stored as citations.
The outlooks were shown to users in an experimental version of the app; rolling them out to the main app was the next planned step. They were news-based views, not price targets or trading advice.
A two-person team
I built the data pipelines and analytics, the RAG pipeline and most of the data and application code. My co-founder handled containerisation and deployment.
What I’d do next
If the project were picked up again, I’d rebuild the main app as a full web application to replace the Streamlit prototypes, and move the news outlooks from the experimental version into it. I’d also publish the data-quality report alongside the data.
More from the project